Josh Maurer/LDEO
The glaciers of the Himalayas are beautiful pieces of the unique landscape at the "roof of the world.” But they're also water towers, filling rivers used by hundreds of millions of people in East and South Asia. The need to understand how climate change is altering these glaciers is obvious.
Data is not plentiful in this inhospitable part of the world, and the climate is particularly complex and variable from across the region. For example, the monsoon rains mean that the glaciers in the eastern portion of the range actually gain most of their snowfall in the summer. With such a huge and varied area, studies have generally only been able to focus on a small subset of glaciers, making it harder to draw broad conclusions across the region. A new study led by Josh Maurer at the Lamont-Doherty Earth Observatory relies on spy satellite photos from the 1970s to make that possible.
Spying on ice
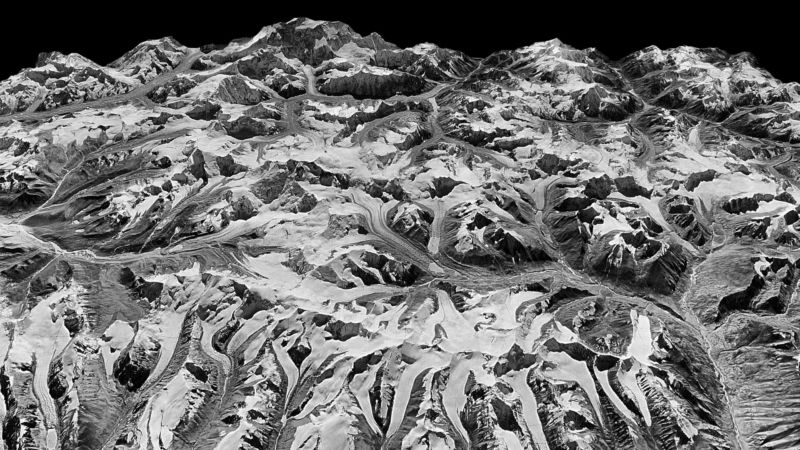
Photos from the US KH-9 Hexagon satellite have been declassified, much to the delight of geoscientists. The trick is extracting precise information from the photos—and in this case, the trick is getting 3D information from 2D images. It's one thing to mark a glacier's extent, but the truly valuable thing is to work out their change in thickness and, therefore, volume.
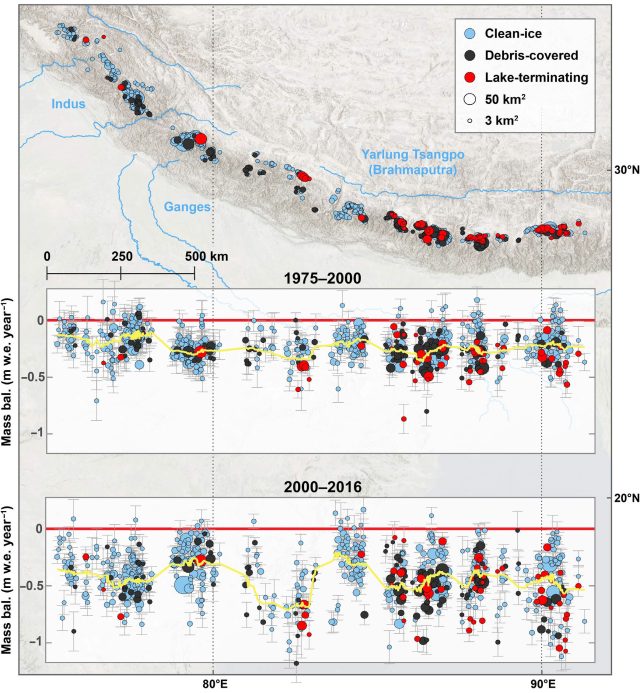
The researchers worked out a way to use data from multiple images taken as the satellite passes over an area. The different angles at which these images capture a glacier allowed the researchers to construct an elevation map in the same way stereo pairs of photos can show depth. The elevation maps allowed them to quantify changes in volume for 650 glaciers nested in valleys, accounting for over half the glacial ice in the Himalayas.
The spy satellite images produced one snapshot in the mid-1970s, and then modern satellite stereo images become available in 2000. The researchers calculated a 1975-2000 trend, and then a 2000-2016 trend to see how things were changing.
One clear result is that the rate of ice loss has increased. Converting ice and snow to the equivalent volume of liquid water, the average thickness change from 1975 to 2000 was about 0.2 meters lost per year. From 2000 to 2016, those same glaciers lost around 0.4 meters per year in thickness—roughly double the rate of shrinkage.
Extrapolating that rate to the rest of the Himalayan glaciers would mean that about 4 billion tons of ice disappeared in 1975-2000. For 2000-2016, that number is about 7.5 billion tons of ice. For context, this means 87% of the Himalayan glacial ice present in 1975 was still around in 2000. By 2016, 72% remained.

Is it hot in here?
The other thing that jumps out is that there isn't very much variability between different areas of the Himalayas. There's plenty of variability between different glaciers—a few gained mass, while others lost much more than the average—but this is true within each portion of the mountains. There are no real systematic differences that might point to regional weather patterns driving separate trends.
That, the researchers say, makes warming temperatures the most likely explanation for all this lost ice. There are other possible factors, like emissions of "black carbon" (soot) from fossil fuel burning in that part of the world. The soot can settle on the snow and increase melting in the summer sun. A rough calculation of the temperature change required to melt that much ice came out at 0.4-1.4°C. The actual warming this region has seen over that time period is about 1°C.
That's a little less warming than the Alps have seen in Europe, for example. The rate of ice loss is also a little slower than for glaciers in the Alps, as well, as you'd expect if temperatures were the key driver in both places.
As another recent study showed, the fact that these glaciers are melting faster than snowfall can rebuild them has real major implications for water supplies. For now, accelerating melt means more water in the river. But this will change, and the supply of meltwater will begin declining when the glaciers shrink and the balance of the ice account becomes too small for us to live off the interest.
Science Advances, 2019. DOI: 10.1126/sciadv.aav7266 (About DOIs).
Không có nhận xét nào:
Đăng nhận xét